Indian Equity Market : Structural Change to Support & Continue Growth
Mutual Fund News on 10 Feb 2023
- Equity schemes saw inflows for the 23rd straight month in January
- Equity mutual funds received inflows worth Rs 12,546 crore in January – the highest in four months
- Average assets under management (AUM) of the industry rose to Rs 40.80 lakh crore, higher than Rs 40.76 lakh crore in the previous month
- Flows through systematic investment plans (SIPs) rose to Rs 13,856 crore – the highest ever through this route – as against Rs 13,573 crore in December. SIP flows include all category of funds like Equity, Hybrid and Debt
Long Term Domestic Money is getting invested in Indian Equity Market through –
- Mutual Funds
- Life Insurance
- Pension Funds
- National Pension Scheme
- Individual / Retail investors investing in Direct Equities using Demat Accounts
- Family Investment Offices / Portfolio Management Services / Boutique Investment Firms / etc
OBSERVATION – Emergence of Giant Sized ( AUM ) Funds and their continued growth in SIZE on Auto-Pilot is the SIGNIFICANT STRUCTURAL CHANGE, which will continue to support the Out-Performance and the Over-Valuation of Indian Equity Market.
AUMs ( Asset Under Management ), jargon for size, of 3 largest Mutual Fund Schemes are –
As on 31 Jan 2023
| Scheme Name | AUM ( Rs Crore ) |
|---|---|
| SBI Equity Hybrid Fund | 55,611 |
| HDFC Balanced Advantage Fund | 51,161 |
| ICICI Balanced Advantage Fund | 44,513 |
Above AUMs are large and impressive amounts. These scheme data and AUM ( size) is public knowledge.
GIANT Funds / ETFs
There are large number mutual fund schemes and ETFs ( Exchange Traded Fund ), information on which are not easily available in public domain. AUMs of these funds are much much larger than above mentioned AUMs. Let’s call these “schemes and ETFs” as “GIANT Funds”. The beauty of these GIANT Funds is, their AUMs have been growing without anybody’s knowledge, without any sales, without any marketing. Basically their AUMs are growing automatically on Auto-Pilot. Must be kidding, how is this possible!
OK, let’s first marble at the AUM size of these Giant Funds – hold on to your breath, do not be surprised on reading further. The undisputed king is “SBI Nifty 50 ETF”, AUM is Rs 1,49,113 Crore. Yes, KOOL Rs 1,49,113 Crore!
Giant Funds / ETFs as on 31 Jan 2023
| No. | Scheme Name | AUM ( Rs Crore ) |
|---|---|---|
| 1 | SBI Nifty 50 ETF | 1,49,113 |
| 2 | SBI Pension Fund Scheme – State Government | 1,48,149 |
| 3 | LIC Pension Fund Scheme – State Government | 1,43,236 |
| 4 | UTI Retirement Fund Scheme – State Government | 1,39,926 |
| 5 | SBI Pension Fund Scheme – Central Government | 85,414 |
| 6 | SBI S&P BSE Sensex ETF | 84,390 |
| 7 | UTI Retirement Fund Scheme – Central Government | 79,730 |
| 8 | LIC Pension Fund Scheme – Central Government | 79,414 |
| 9 | SBI Pension Fund – Corporate | 53,678 |
Surely, impressive size of above Giant funds!
Now let’s focus on GROWTH in assets or size or AUMs of these Giant Funds.
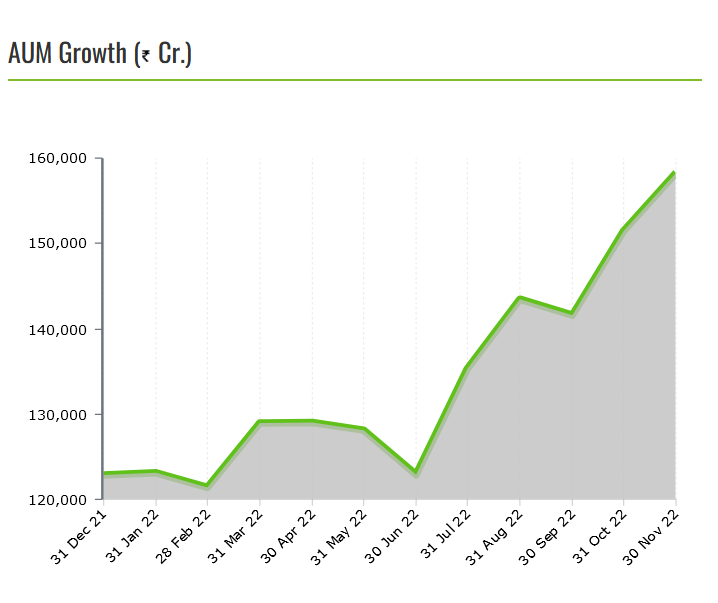
AUM Growth chart of “SBI Nifty 50 ETF” is –

The impressive and staggering growth in AUM is happening inspite of Nifty Index growing by only 4.5% in last year. And AUM is growing without anybody’s awareness, without any sales, without any marketing! Must be wondering, how are these AUMs growing, are they on steroids?
Get in touch to know “How Giant Funds are Growing on Auto-Pilot
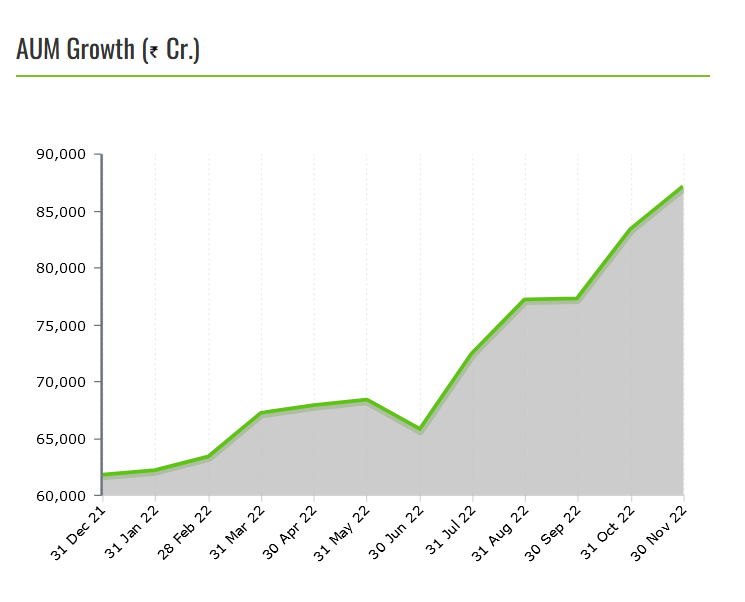
Just to emphasize the growth aspect, AUM Growth chart of “SBI S&P BSE Sensex ETF” is –

CONCLUSION – Inflow into Indian Equity Market is a long term secular change : Understand this, Accept this and Embrace this positive change to participate in the growth story of Indian Equity Market and benefit from it over the long run!
References – economictimes.indiatimes.com, valueresearchonline.com, infinitywealthonline.in, sbimf.com
DISCLAIMER –
Equity/Stock/Share/Mutual Fund investment are subject to market risks. The article/post is NOT an investment advice. The article/post is an opinion. Please do your own research and/OR consult your investment advisor before making your investment. Past performance is not indicative of future returns. Please consider your specific investment requirements before choosing your investments or designing a portfolio that suits your investment needs. The article/post or the author cannot be held responsible for any losses